you are here > Class Notes - Chapter 13 - Lesson 13-4
   

Printable version

Graphing Inequalities - Lesson 13-4

Today, we learned about graphing inequalities. We started by reviewing the following hints for doing this:

Hints for Graphing Inequalities

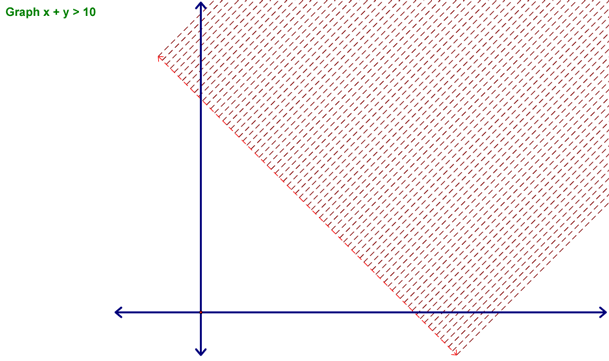
Then we did the following example:

Example of Graphing an Inequality

For the example, we took the following steps:

  1. Put the equation in y = mx + b form: y > -x + 10.
  2. Graphed the line y = -x + 10...we did this as a dotted line since the inequality is just >, not > or =.
  3. Plugged the point (0, 0) into the equation to see if it resulted in a true statement...it didn't (0 is not > 10), so we shaded on the side of the line opposite to (0, 0).

That's it! you should be able to do problems that use these techniques now!

Other Links
Class Notes
Lesson 13-1
Lesson 13-2
Lesson 13-3
Lesson 13-4
Lesson 13-6
Quiz Topics


If you have questions, email me at baroodyj@doversherborn.org